
Electrolyte Abnormalities
- The “hypers” (K, Ca) shorten the QT interval
- The “hypos” (K, Ca) prolong the QT interval
- K abnormalities affect the T waves (increased K: narrow Ts; decreased K: wide Ts)
- Ca abnormalities affect the ST segments (increased Ca: shorter STs; decreased Ca: longer STs)
|
Hyperkalemia
|
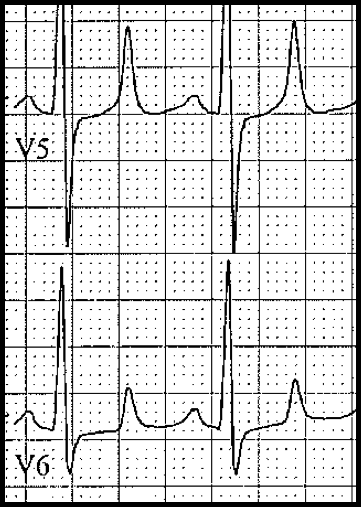
|
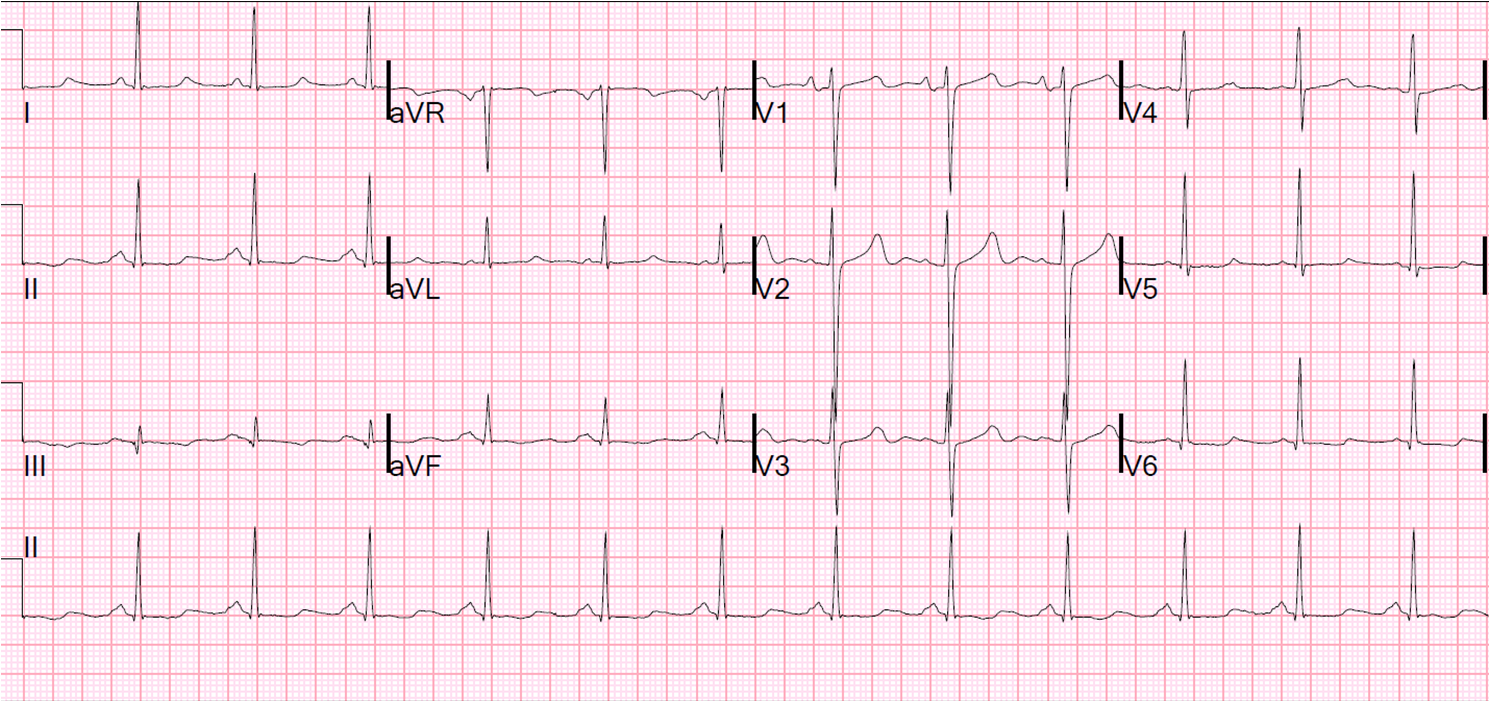
Hypercalcemia
- ST segment shortened
- T waves are inscribed right after the QRS complex
- May mimic coved ST segment elevation in anterior chest leads
- May rarely cause a normothermic Osborn wave
- ECG findings of hypercalcemia usually signify severity of hypercalcemia
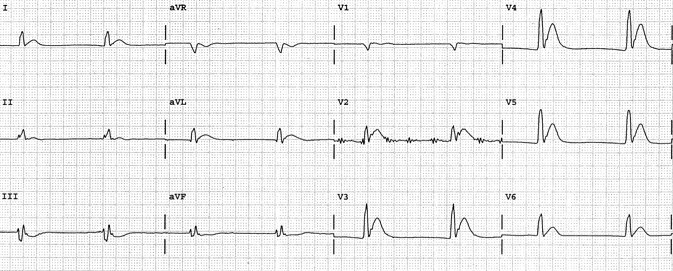
Hypokalemia
- Nonspecific ST depression (usually upsloping)
- Wide, bifid T waves or T-U complexes
- Prolonged QT/QU intervals
- “Wavy ST-Ts” (3 waves between QRS complexes: T – U – P)
- Severe hypokalemia may mimic ischemic ST segment depression
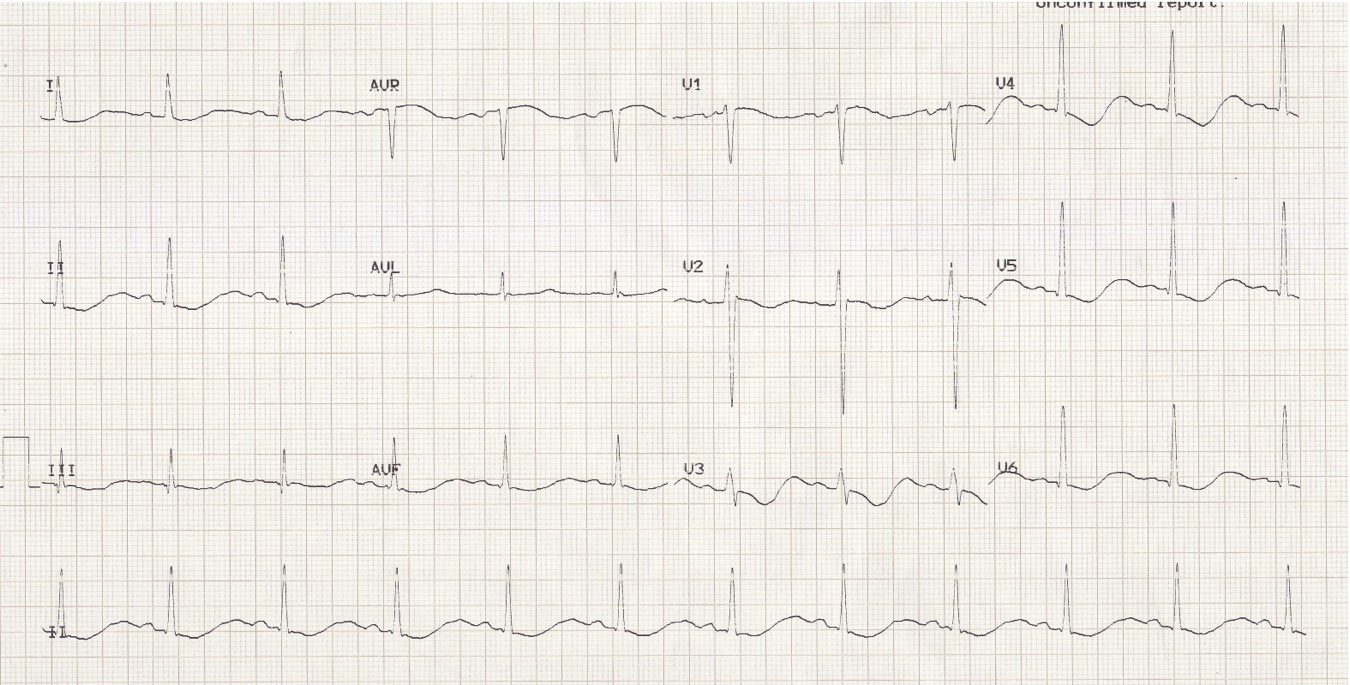
Hypocalcemia
- Nice, smooth, normal looking T waves
- Prolonged ST segments – T waves are pushed to the right
- Prolonged QT intervals
- A similar pattern is frequently seen in pts with advanced liver failure, even with normal Ca
Chronic renal failure, uremia
- Combination of hyperkalemia and hypocalcemia
- Flat, long ST segment followed by narrow-based, peaked T wave (“tent on a desert”)
- Slowly upsloping ST segment followed by peaked T wave; QT prolonged